Results of the 2019 House of Councillors Election in JapanThe last victory of Shinzo Abe
The last victory of PM Shinzo Abe
Hello, everyone. After a long time, I am back! It has been some busy months for me and I have not been able to write new articles.
「I recently made a weekly Newsletter about Japan and Japanese politics. You can sign up on the link! https://nihonpolitics.substack.com/welcome 😀📧」
This particular report has been tough to write. The research was long and I had to fix some late-minute mistakes. The article itself is a fully-detailed analyst of the last national election we had in Japan, the 2019 House of Councillors Election where the LDP won, again, but was short of a two-thirds majority, including Komeito and Ishin no Kai, to reform the Constitution.
In the article, I focus and analyze, the national proportional (party) vote 「比例代表」which allows us to see the strength of each political party beyond individual candidates.
In last year’s Election, the LDP and Komeito were able to retain their majority in the House of Councillors but they did not achieve Abe’s goal of reaching a 2/3rds majority that would allow him to more easily reform the Japanese Constitution (Kansai-based Ishin no Kai could hypothetically help them though).
I hope you like it. Please give me some feedback too! Any criticism is welcomed. I am here to learn! :)
始まりましょう!
First of all, we start with the full nationwide proportional results.

If we take a look at the results from the national proportional list 「比例代表」we can see several things.
The LDP was the clear winner of the election, taking over 35% of the vote. Komeito, although stuck in low double digits, brings the government coalition close to 50% of the national vote.
On the Opposition camp, the CDPJ is the first party. The DPFP is very diminished in comparison to the late Party of Hope. On the left-wing, The Japanese Communist Party has been able to maintain its strength around 8%, while the SDPJ cannot contain its 20 year-long fall. Also in 2019, a new grassroots progressive party, run for the first time -Reiwa Shinsengumi- and managed to grab 4.5% of the vote and won two councilors in the proportional list. An impressive feat.
In the third camp of Japanese politics, Ishin no Kai keeps rising, consolidating its position in Kansai where it has become a dominant force in Osaka and Hyogo.
The (joke?) anti-NHK party won 2% of the vote. The cult-like 幸福実現党, half a point.
The state of Japanese politics becomes much more clear when we compare it to the results in 2017. Japanese politics have changed A LOT in the last three, four years.
The reorganization mainly affected the Opposition parties. The Democratic Party of Japan disintegrated. It (largely) divided itself into two new parties: on the left-wing, the CDPJ and on the right-wing, the Party of Hope. In the 2017 House of Representatives Election the, Party of Hope led by popular Tokyo Governor Yuriko Koike, busted.
From that disaster, and jointly with old remnants of the Japan Innovation Party (not to confuse with Ishin no Kai although they had common roots), appeared the Democratic Party for the People.

2017 PROPORTIONAL BALLOT — 2019 PROPORTIONAL BALLOT
In the Lower House Election (2017) the proportional vote is done in each prefecture individually. Later it is reorganized by reginal blocs that allocate the members elected. In the Upper House Election (2019), seats are allocated within each prefecture, expect in the case of four prefectures that share the same electoral district: Tottori-Shimane and Tokushima-Kochi.
Please read the graph from RIGHT (2017) to LEFT (2019) to appreciate the change.
The Opposition parties dropped almost 9% between 2017 and 2019 in spite of the appearance of the grassroots Reiwa Shinsengumi.
CDPJ#: -4.2%
DPFP*#: -10.5
On the left, both the JCP and the SDPJ grew, a little:
JCP: +1%
SDPJ: +0.4%
- *The DPFP did not exist in 2017, but I am considering the Party of Hope as its predecessor.
- #At the time of this writing, both the CDPJ and the DPFP have suspended the talks they had started for a few weeks to join forces, creating a new party, or with the absorption of the smaller DPFP by the CDPJ. However, the CDPJ and the small SDPJ continue their talks about a possible merger (UPDATE: The merger took place in the last months of 2020, but a dozen lawmakers from the DPFP, including its leader Tamaki Yuichiro, ¡decided to remain in the party)
The LDP, on the other hand, grew around 2% while Komeito is stuck at 13% of the national proportional national vote.
In the third camp, Ishin no Kai was the party with the largest growth: +3.7%
Now, on to the details. Next, I will present three different sets of maps:
- First, position maps. They will show which party placed first, second, third and fourth in each prefecture.
- Second, strength maps. These show each party’s vote strength throughout Japan.
- Third, comparison maps & correlations. These maps show the comparison between 2017 and 2019 results. Also, I will present several correlations between the parties.
POSITION MAPS
FIRST PLACE

In what is no surprise, the LDP is the first political party of Japan. It won everywhere but in Osaka where Ishin no Kai (the local party) has become (even more) dominant in the last years.
While the were second in 2019, the LDP managed to win in Osaka the proportional vote in the 2017 HoR election (by less than 10k votes).
SECOND PLACE
Which party placed second in each prefecture? This map is extremely interesting. It shows a pretty straightforward East-West (North-South) division of Japan, ever-existing since the Sengoku Period>Boshin War, isn’t it?
Beyond Nagoya, the CDPJ is the second party in every prefecture but in Toyama (why? If anyone has an explanation, let me know!). To the West, the Buddist-based Komeito is the second party save in a some scattered prefectures:
- Ishin no Kai is the second strongest party in Kansai: Hyogo, Nara and Shiga Prefecture
- The Japanese Communist Party in Kyoto, a prefecture that has been fertile ground for the party.

- The DPFP only managed to place second in Kagawa. It might be explained because its leader, Tamaki Yuuichiro represents Kagawa’s 2th district since 2009.
- The SDPJ, in its continuous decline, was able to be second in two places where it has been traditionally strong and still is the first party of the Opposition camp: Oita and Okinawa.
THIRD PLACE

The third-place map is largely the mirror of the map of the second place.
- The DPFP managed to be the third party in Saga, Nagano, Shizuoka and Iwate.
- Ishin no Kai was third after Komeito and LDP in Wakayama (its second weakest prefecture in Kansai after Kyoto).
- The JCP was third in Kochi, another traditional stronghold of the party.
FOURTH PLACE
In fourth place, the JCP and the DPFP fight it out. In the election, they were separated by 2 points and roughly 1 million votes (in favor of the JCP).
At the national level, Ishin no Kai was Japan’s fourth strongest party, but it does not show in this map given that its power is based in Kansai where it ranks higher.

PARTY MAPS
LDP 「自由民主党=自由党」35.4% (+2.1% compared to 2017)
In this map, two prefectures stand out: Yamaguchi and Ishikawa

Ishikawa and Yamaguchi (PM Abe Shinzo home turf) stand out as the best prefectures for the LDP. The party cracked the 50% ceiling in both places. It was especially strong in Kyushu, Chugoku and the Sea of Japan (PM Tanaka Kakuei’s 裏日本). In the places it was able to grow, the party was already dominant.
Largest increases (compared to 2017)
- Yamagata (+10.7%): 34.5%>45.2%
- Ishikawa (+8.2%): 43.3%>51.5%
- Nagasaki (+8%): 34.9%>42.9%
The LDP was not able to win more than 30% in the Tokyo Metropolitan area and in Kansai, around Osaka (neither in Hokkaido): the big urban areas of Japan. Specifically, it was in Kansai where the LDP founds its only losses in the whole country:
Largest(and only) decreases
- Osaka (-6.5%): 27.1%>20.6%
- Hyogo (-3%): 32.3%>29.3%
- Nara (-1.1%): 35.3%>34.2%
- Kyoto (-0.4%): 31.2%>30.8%
However, the LDP won 7.3% more in Wakayama compared to 2017, one of the party’s largest improvements in the whole country.
In the updates I will publish, I want to go deeper into two hypotheses that seem pretty straightforward, regarding the LDP results in 2019:
One, the LDP reclaimed votes that went to the Party of Hope in 2017, especially in Tohoku where it improved its standing, a lot.
Two, the LDP continues to lose voters to Ishin no Kai in Kansai, specially in its right flank.
CDPJ 「立憲民主党」15.8% (-4.2% compared to 2017)
The Constitutional Democratic Party of Japan has become in a few years the second biggest party of Japan, and the number one in the Opposition field.

This map shows a pretty stark divide North-South (or East-West). The presence of the CDPJ is over 15% from Aichi towards the East and North. It is a party with a commanding presence (behind the LDP) in Tokyo and its neighboring prefectures: Chiba, Saitama, Kanagawa and beyond, across Nagano towards Niigata.
I was certainly surprised to see that Aomori in Tohoku was the CDPJ’s best prefecture. In fact, it was 1 of only 3 prefectures where the CDPJ’s share of the vote grew since 2017:
Largest (and only) increases
- Aomori: (+6.6%) 15.4%>22%
- Miyazaki: (+0.9%) 14%>14.9%
- Akita: (+0.2%) 13.3%>13.5%
Largest decreases
- Aichi (-7.2%): 22.8%>15.6%
- Okinawa (-7.1%): 15.1%>8%
- Oita (-6.8%): 17.4%>10.6%
Komeito 「公明党」13% (+2.5% compared to 2017)
Komeito is the third-largest party in Japan. In 2019, it won 13% of the vote, increasing its share by half a point compared to 2017’s House of Representatives election (12.5%>13%).

Komeito’s strength is the mirror image of the CDPJ. Komeito is strongest in the West: Kansai, Chugoku and Kyushu.
The biggest changes in Komeito’s vote share took place in the following prefectures:
Largest Increases:
- Nara (+2.1) 12.2%>14.3%
- Chiba (+2%): 12.1%>14.1%
- Saga (+1.8%): 12.3%>14.1%
Largest Decreases:
- Okinawa (-2.8%): 17.3%>14.5%
- Yamagata (-2.1%): 12%>9.9%
- Miyazaki (-1.6%): 16.7%>15.1%
A few days ago after I posted this map of Komeito, a really interesting conversation popped up on Twitter about its strength and reasons for it. I will leave it here in the form of Twitter thread.
Ishin no Kai 「維新の会」9.8% (+3.7% compared to 2017)
Ishin no Kai is the fourth largest party in Japan. A regional party born and centered around Osaka in Kansai, it is slowly expanding to other parts of Japan. It is also on its way to becoming the first party of Japan at the national level (elections) in its strongholds.

Compared to 2017, Ishin no Kai grew its share of the vote everywhere but in two prefectures:
- Nagano (-0.3%): 5.6%>5.3%
- Okinawa (-3.2%): 7.3%>4.1%.
It managed to expand its dominance even more in prefectures where it was already important. It won in Osaka and came in just 7.6 points short to win in Hyogo:
Osaka (+8.2): 26.9%>35.1%
Hyogo (+8.1): 13.6%>21.7%
Toyama (+7.5): 7%>14.5%
The case of Toyama was particularly surprising. It is Ishin no Kai’s best prefecture outside of Kansai.
In 2019 it won 14.5% of the vote, around 58 thousand votes. When I wondered on my twitter account @NihonPolitics about these results, user @cysgluala pointed me to a possible explanation that seemed plausible.
The good results for Ishin no Kai might be because of the presence of Shibata Takumi, a 2-term House of Councillor member of Ishin no Kai from the proportional block. He is from Toyama (he was a member of the Toyama Prefecture Assembly from 1999 to 2009) and in 2016 he run for the HoC. As a favorite son, he seems pretty popular. Let’s take a look: In 2019
Ishin no Kai won 58k votes in Toyama, 14.5% (proportional vote)
- 22k were straight party-list votes.
- 35k were votes were a single candidate in the party list is chosen.
*>> Of these, 33k votes were for Shibata Takumi alone, a very impressive percentage: 95% of the “handpicked candidate” vote and 57% of the total votes for the party in Toyama were for him personally.
If we look back to 2016, we find the same story:
Democratic Party「民進党」where Shibata Takumi belonged in 2016 won 116k (24.2%) in Toyama.
- 40k were straight party-list votes.
- 76k were “handpicked candidate” votes.
*>> Out of these, Shibata Takumi won roughly 50k: 66% of the “handpicked candidate” vote and 43% of the total votes Minshintou won in Toyama.
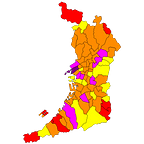
JCP 「共産党」8.9% (+1% compared to 2017)
The Japanese Communist Party, the oldest of the political parties in Japan, won 8.9% of the vote in 2019. It grew 1% compared to 2017 (7.9%>8.9%).

Judged by its results, the JCP is eminently an urban party. Its strength is found around the big cities of the country like Tokyo (11.3%), Kanagawa (9.6%) and Osaka (9.6%)
However, it posted its best results in Kyoto (it grew +3.4% since 2017) and Kochi, both traditional strongholds of the party.
Largest increases:
- Kyoto (+3.4): 14.1%>17.5%
- Hokkaido (+3.1%): 8.5%>11.6%
- Akita (+2.3): 5.8%>8.1%
Among the few places where the JCP lost share of the vote, Okinawa was the worst (-1.4%).
DPFP 「国民民主党」 6.9% (-10.5% compared to 2017)
The Democratic Party for the People can be considered the successor of the old Party of Hope formed by Yuriko Koike in the run-up to the 2017 HoR election.
The Party of Hope 「希望の党」failed and it disbanded soon after. The remnants of Kibou no To, along with former people from the LDP and Nippon Ishin no Kai formed the DPFP.
If we establish a comparison, a steep decline took place.
Hope>DPFP : (-10.5%) (17.4%>6.9%)

The DPFP was able to maintain a certain level of strength in very heterogeneous prefectures. Kagawa was the party’s best result: DPFP leader Tamaka Yuuichiro represents Kagawa’s District 2.
Beyond Kagawa, its best prefectures were: Saga, Fukui, Mie, Shizuoka, Nagano, Fukushima and Iwate.
It happened everywhere. The DPFP couldn’t hold the Party of Hope vote share of the vote in a single prefecture:
Largest decreases:
Yamagata (-17.6%): 25%>7.4%
Akita (-17.5%): 26.1%>8.6%
Ishikawa (-16.9%): 23.7%>6.8%
The party collected its smallest decrease in Osaka prefecture, where it fell just 2.2% (from 6% to 3.8%). The plausible explanation is not that it retained meaningful support in Osaka, but that it had a low ceiling, to begin with (at least in this case).
Reiwa Shinsengumi 「れいわ新選組」4.5% (new party)
Reiwa Shinsengumi was founded just a few months before the election as a grassroots progressive platform. Its leader, Yamamoto Taro, a former actor, had previously been a member of the House of Councillors from 2013 to 2019 in the Tokyo prefectureconstituency.
Last year, in 2019, the party won 2 seats in the proportional list.

It is clear that the Kanto region(Tokyo Metropolitan Area) was Reiwa’s base: Reiwa had its best results in Tokyo (7.9%), Okinawa (7.3%), Kanagawa (5.7%) and Saitama (4.8%).
SDPJ 「社会民主党」2.1% (+0.4% compared to 2017)
The Social-Democratic Party of Japan, in a slow decline since the 1990s, won just a mere 2% of the vote nationally. About its strength, it is striking the way it is concentrated in very limited places. The party was able to win over 10% in only two prefectures:

in both, it also increased its share of the vote:
- Okinawa (+7.9%) 11.3%>19.2%
- Oita (+3.2%) 11.8%>15%
It is interesting to consider the party’s presence in Tohoku and Kyushu (over two percent of the vote) compared to the rest of the country.
COMPARISON MAPS
In the next set of maps, I want to show a comparison between the 2017 House of Representatives election results and the 2019 House of Councillors election results, in the proportional list (nationwide). In addition, I will shoe several correlations I have analyzed.
Before diving into the results, I want to advise everyone that I am comparing here results from two different elections from different chambers of the Diet: 2017 House of Representatives election and 2019 House of Councillors Election. A change in turnout msut be taken int oaccount, just to provide caveats to the oversll analysis.
LDP COMPARISON
2017: 33.3% >>> 2019: 35.4%

The Liberal Democratic Party was able to recover some lost ground from 2017. It grew over 3% nationally, (however, it lost around 800k votes nationally. from 18.5 to 17.7million). The party managed to improve its standing everywhere but in a single region of the country: In Kansai. The ascendancy of Ishin no Kai might explain the LDP’s loss of votes here.
The LDP support decreased in four prefectures: Osaka: -6.5%, Hyogo: -3%, Nara: -1.1% & Kyoto: -0.3%
Ishin already placed first in Osaka, and it is on its way to eventually winning also in Hyogo (results):
LDP (-3%): 32.3%>29.3%
Ishin (+8.1%): 13.6%>21.7%
Komeito (+1.5%): 13.4%>14.9%
The LDP’s big increases took place in Tohoku and Kyushu.
About the correlation analysis, I have done with the LDP, I will present down them below in the part concerning Ishin no Kai and the DPFP.
KOMEITO COMPARISON
2017: 12.5% >>> 2019: 13%
Komeito was able to maintain its 2017 results, stretching them a bit in the percentage of the vote. However, the party lost over 400k votes (2017 HoR>2019HoC).

The increases were not large in any case: Komeito gained a larger vote percentage in northern Kanto and in Kansai, a reversal of what happened in Kyushu, a traditionally good region for the party.
CORRELATION 1: KOMEITO and ISHIN NO KAI
To explore if we could establish a relationship between Komeito and Ishin and the changes that took place between 2017 and 2019, I ran a correlation and it came back positive: 0.399
At a larger increase for Ishin, a larger one also for Komeito (in the same prefectures). And vice versa.

Komeito and Ishin no Kai are in a joint struggle in Kansai and Osaka, a prefecture that is essential for the strength of both parties nationally.
After a time facing each other, both parties seem to be making amends. For instance, Komeito now supports Ishin’s plan to turn Osaka into a Tokyo-like metropolis administrative system; furthermore, the party did not run candidates against the Komeito incumbents Komeito has in four districts in Osaka Prefecture.
This article by NIKKEI is interesting in this regard.
A second correlation, this time about their level of support, also shows a positive result:

CDPJ COMPARISON
2017: 20% >>>2019: 15.8%
The Constitutional Democratic Party won 20% of the vote in 207, the first time it ran in a national election. Last year it lost roughly 4 points in comparison and more than 3 million votes!

The losses of the party were widespread but with a lot of variation between prefectures.
For some reason, it lost over 6% in three places: Yamanashi, Mie, and Oita
Its only increases in the vote percentage took place in three prefectures:
Miyazaki, where it grew a negligible 0.6%, and in two contiguous prefectures of Tohoku: Akita (+0.2%) and Aomori, the party's best prefecture in the whole country where the CDPJ managed to grow over 6% with just 10k raw votes more (increased from 90k to 100k).
CORRELATION 2: CDPJ and REIWA
Could have CDPJ been hurt by the presence of the new Reiwa Shinsengumi? Maybe. Yamamotos’ group won over 2.2 million votes.
The correlation was therefore negative in terms of changes: -0.301

If we compare their prefecture-by-prefecture results, the correlation comes up positive:

It is very possible that Edano’s CDPJ lost some votes to the vibrant group of Yamamoto Taro, Reiwa Shinsengumi.
DPFP>Party of Hope COMPARISON
2017 (Party of Hope) 17.4% >>> 2019 (DPFP): 6.9%
I have decided to make a straight comparison between the Party of Hope that Yuriko Koike set up in 2017 and the recently-created Democratic Party for the People, although it is obvious that the succession was not straight forward.
The results show very clearly the nature of the DPFP when you detract the votes that in 2017 the Party of hope managed to agglutinate. Many of these are gone.

As expected, if we establish the comparison, the DPFP was not able to maintain the strength of the Party of Hope. Especially hard are the decreases in the northern part of Honshu, Tohoku. But it happened everywhere:
The Party of Hope, led by Yuriko Koike, won 9.6 million votes in 2017; last year, the DPFP won 3.4 million, a decrease of more than 50%
For the sake of clarity. I made the map of the 2017 Party of Hope election results:

The Party of Hope managed to get very good results in northern Honshu, in Tohoku especially; the same places where it suffered the largest drops in comparison to 2019.
Besides Tohoku, the Party of Hope had excellent results in the Chubu Region「中部地方」: Aichi, Gifu, Shizuoka. Nagano, Ishikawa and Fukui, where it won more than 20% of the vote.
CORRELATION 3: LDP and DPFP/PARTY OF HOPE
The first relationship I was very interested in testing was the one between the LDP and the DPFP/Party of Hope. Could it be possible that some of the lost votes in the 2017 to 2019 transition (from the Party of Hope to the DPFP) went to the LDP? It seems so.
And the correlation certainly points that way: strong negative correlation of -0.440

It seems that the LDP managed to strengthen its position, especially where the drop between the Party of Hope and the DPFP was strongest, like in Tohoku.
The negative correlation turns positive when we analyze their election results from 2019: both parties detract from each other (2017>2019), but, therefore, they gain votes with some similarity in their regional source of strength.

ISHIN NO KAI COMPARISON
2017: 6.1%>>>2019: 9.8%
Ishin no Kai was able to increase its strength across the board, getting close to the 10% mark nationally.
It grew from 3.3 million votes to 4.9, more than one million and a half more since 2017.
It only lost support in Nagano and Okinawa while it kept growing in its stronghold of Kansai as well as in Tokyo, Hokkaido and central Japan, basically.

CORRELATION 4: ISHI NO KAI and LDP
To analyze the voting relationship between Ishin no Kai and the LDP (in their strength throughout Japan, I ran a correlation, and the results that came out were very interesting:

I found a very strong negative correlation between the LDP and Ishin no Kai. With all the caveats applied (“correlation does not mean causation”…):
At a larger increase (of vote percentage) for Ishin no Kai, a larger decrease for the LDP.
At a larger LDP increase, a lower Iishin no Kai increase.
Straightforward. The presence of Ishin no Kai appears to be problematic for the LDP in a big way; I was certainly surprised by the large negative correlation that came up. This same result is also found in a correlation between their 2019 election results: -0.517

JCP COMPARISON
2017: 7.9%>>> 2019: 8.9%
The Japanese Communist Party managed to increase one point in comparison to 2017. Not much, but it stopped a slide, stabilizing around 9%. It just gained just shy of 80 thousand votes from 2017 (4.404 million) to 2019 (4.483m).

The JCP grew over 3% in Kyoto, its best prefecture and a traditionally favorable place for them. Also in Hokkaido, Kochi and the northern suburbs of Tokyo like Saitama and Chiba.
Thank you so much for spending your time reading my articles. I truly appreciate it :)
Spread the word!!
ご覧頂きありがとうございます!